Introduction
Overview
This lab demonstrates the basics of Amazon Elasticsearch Service as a log analytics solution, using Amazon CloudTrail as a log source, Amazon CloudWatch Logs as a storage and delivery method, Amazon Elasticsearch Service for storing and analyzing logs, and Kibana for visualizing log data.
Topics covered
By the end of this lab you will be able to:
Send CloudTrail logs to S3 and CloudWatchLogs
Subscribe an Amazon CloudWatch Log Group to Amazon Elasticsearch Service
Use Kibana to analyze and understand your AWS resource usage
Amazon Elasticsearch Service
Amazon Elasticsearch Service introduction
Amazon Elasticsearch Service is a managed service that makes it easy to deploy, operate, and scale Elasticsearch in the AWS cloud. Elasticsearch is a popular open-source search and analytics engine for use cases, such as log analytics, real-time application monitoring, click stream analytics, and text search.
With Amazon Elasticsearch Service, you get direct access to the Elasticsearch open-source API so that existing code and applications will work seamlessly. You can set up and configure your Amazon Elasticsearch cluster in minutes from the AWS Management Console.
Amazon Elasticsearch Service provisions all the resources for your cluster and launches it. Amazon Elasticsearch Service automatically detects and replaces failed Amazon Elasticsearch nodes, reducing the overhead associated with self-managed infrastructures. You can deploy an Amazon Elasticsearch cluster in minutes using the AWS Management Console. There are no upfront costs to set up Amazon Elasticsearch clusters, and you pay only for the service resources that you use.
Amazon Elasticsearch Service offers the following benefits of a managed service:
Simple cluster scaling via API
Self-healing clusters
High availability on-demand
Automatic cluster snapshots for data durability
Security
Cluster monitoring
Prerequisites: components of Amazon Elasticsearch Service
Amazon Elasticsearch Service contains the following components:
Domain: An Amazon Elasticsearch domain comprises an Elasticsearch cluster – hardware and software – along with additional hardware and software providing load-balancing, security, and monitoring. The domain is exposed by service endpoints for Amazon Elasticsearch Service, with a name that must meet the following criteria:
Uniquely identifies a domain within an AWS account
Starts with a letter or number
Contains at least three characters, but not more than 28 characters
Contains only lowercase characters a-z, the numbers 0-9, and the hyphen (-)
Cluster: A cluster is a collection of one or more data nodes, optional dedicated master nodes, and storage required to run Elasticsearch .
Node: A node is single instance within an Elasticsearch cluster that has the ability to recognize and process or forward messages to other nodes.
Storage: Amazon Elasticsearch Service supports two distinct storage types, the Instance (default) storage or Elastic Block Store (EBS) – general purpose (SSD), provisioned IOPS (SSD), and magnetic.
Related Services
Amazon Elasticsearch Service is commonly used with the following services:
AWS CloudTrail
Use AWS CloudTrail to get a history of the Amazon Elasticsearch Service API calls and related events for your account. CloudTrail is a web service that records API calls from your accounts and delivers the resulting log files to your Amazon S3 bucket. You can also use CloudTrail to track changes that were made to your AWS resources.
Amazon CloudWatch
An Elasticsearch domain automatically sends metrics to Amazon CloudWatch so that you can gather and analyze performance statistics. You can monitor these metrics by using the AWS CLI or the AWS SDKs. You can also easily subscribe a CloudWatch Logs log group to an Amazon Elasticsearch Service domain to load the data in that log group into Amazon ES.
Amazon Kinesis
Amazon Kinesis is a managed service that scales elastically for real-time processing of streaming data at a massive scale. Amazon Elasticsearch Service provides Lambda sample code for integration with Kinesis.
Amazon S3
Amazon Simple Storage Service (Amazon S3) is storage for the Internet. You can use Amazon S3 to store and retrieve any amount of data at any time, from anywhere on the web. Amazon Elasticsearch Service provides Lambda sample code for integration with S3.
AWS Identity and Access Management (IAM)
AWS Identity and Access Management (IAM) is a web service that you can use to manage users and user permissions in AWS. Use IAM to create user-based or IP-based access policies for your Amazon Elasticsearch Service domains.
Amazon Elasticsearch Service Integration with Other Services
Amazon Elasticsearch Service integrates with the following services to provide data ingestion:
AWS Lambda
AWS Lambda is a zero-administration compute platform for back-end web developers that runs your code in the AWS cloud and provides you with a fine-grained pricing structure. Amazon Elasticsearch Service provides sample code to run on Lambda that integrates with Amazon Kinesis and Amazon S3.
Amazon DynamoDB
Amazon DynamoDB is a fully managed NoSQL database service that provides fast and predictable performance with seamless scalability. Amazon Elasticsearch Service provides a Logstash plugin to support DynamoDB streams and sign AWS service requests.
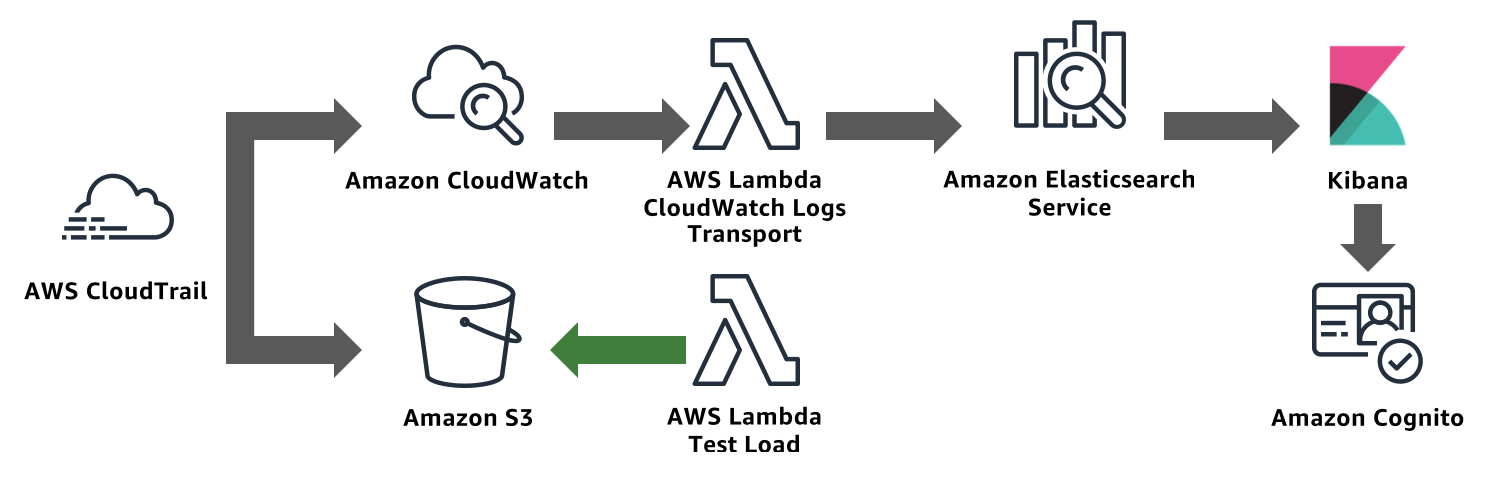
Lab Overview
 {width=“6.8125in” height=“2.173611111111111in”}
In this lab, you will use CloudFormation to deploy
An AWS CloudTrail Trail. CloudTrail collects logs from AWS services when you make calls to their APIs
An Amazon S3 bucket to serve as the destination for CloudTrail logs
An Amazon CloudWatch Logs log group for CloudTrail to deliver logs
An Amazon Elasticsearch Service domain. CloudWatch Logs (via Lambda) sends CloudTrail’s log lines to this Amazon Elasticsearch Service domain
An Amazon Cognito User Pool and Identity Pool. Amazon Elasticsearch Service’s Kibana integrates with Cognito to provide a login experience for Kibana. The template also includes a custom Lambda function that creates a Cognito user and Cognito domain for serving login requests
[OPTIONAL] A second CloudFormation template provides a second S3 bucket and a Lambda function to write objects to that bucket. You can use this Lambda to generate S3 API calls and enable logging of those calls to generate traffic for your domain
Send CloudTrail logs to Amazon Elasticsearch Service
Deploy the first CloudFormation Stack
Sign in to the AWS Management Console
Select US East (N. Virginia) in the region selector
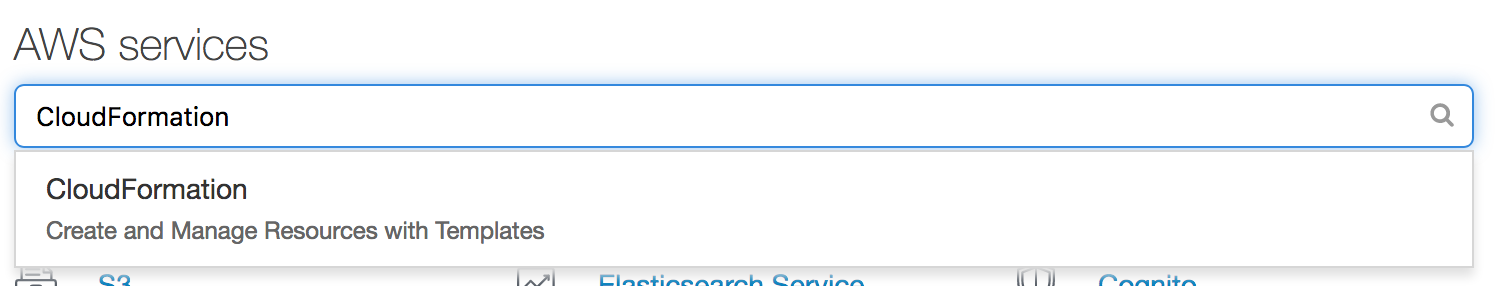
In the search box, type CloudFormation and click CloudFormation.
 {width=“6.8125in” height=“1.2986111111111112in”}
Click Create Stack (If you don’t have any stacks, click the Create New Stack).
Click Specify an Amazon S3 template URL radio button and paste the following URL in the text box.
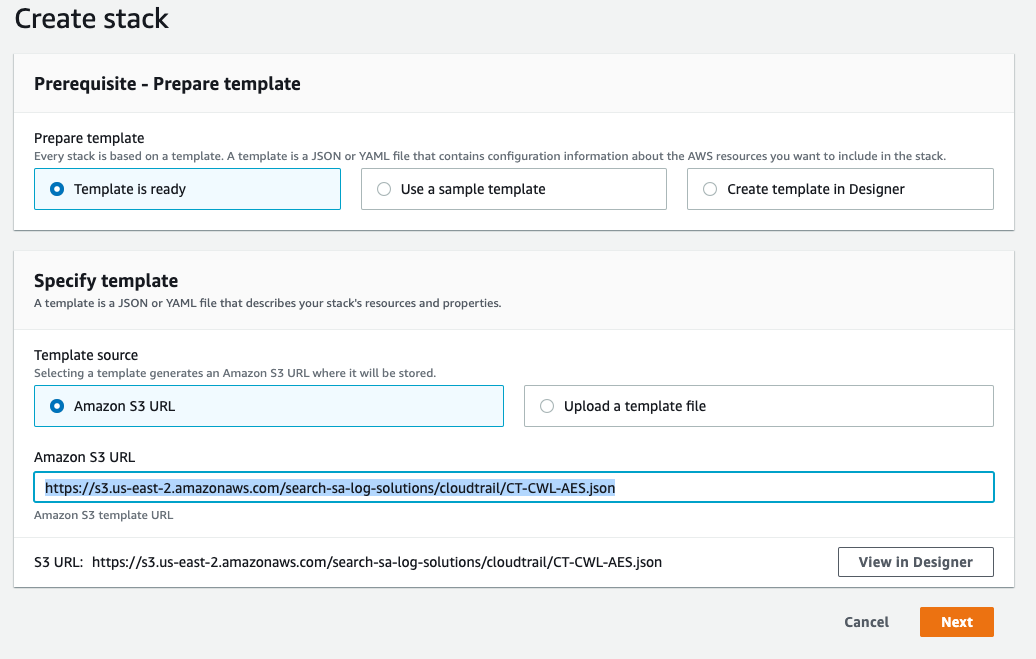 {width=“6.710416666666666in” height=“4.261805555555555in”}https://s3.us-east-2.amazonaws.com/search-sa-log-solutions/cloudtrail/CT-CWL-AES.json
Click Next.
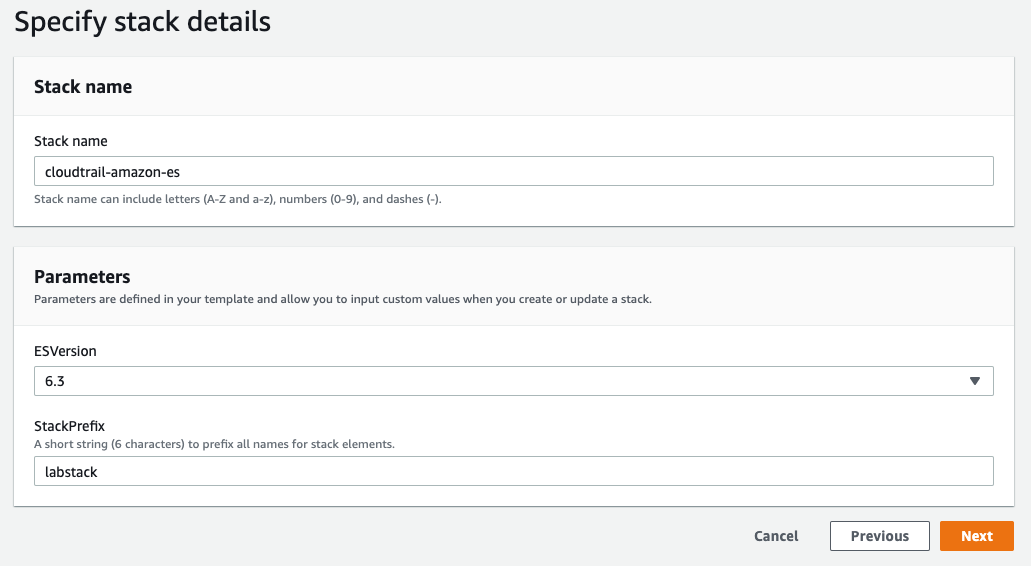
Give your stack a Stack name. Leave the ES Version as 6.3, and set a Stack Prefix. The stack prefix can be any short string and will be used as a prefix for all of the resource names in the stack.
 {width=“6.632171916010499in” height=“3.6446522309711287in”}
Click Next.
Leave the Options and Advanced Options at their defaults, scroll down and click Next.
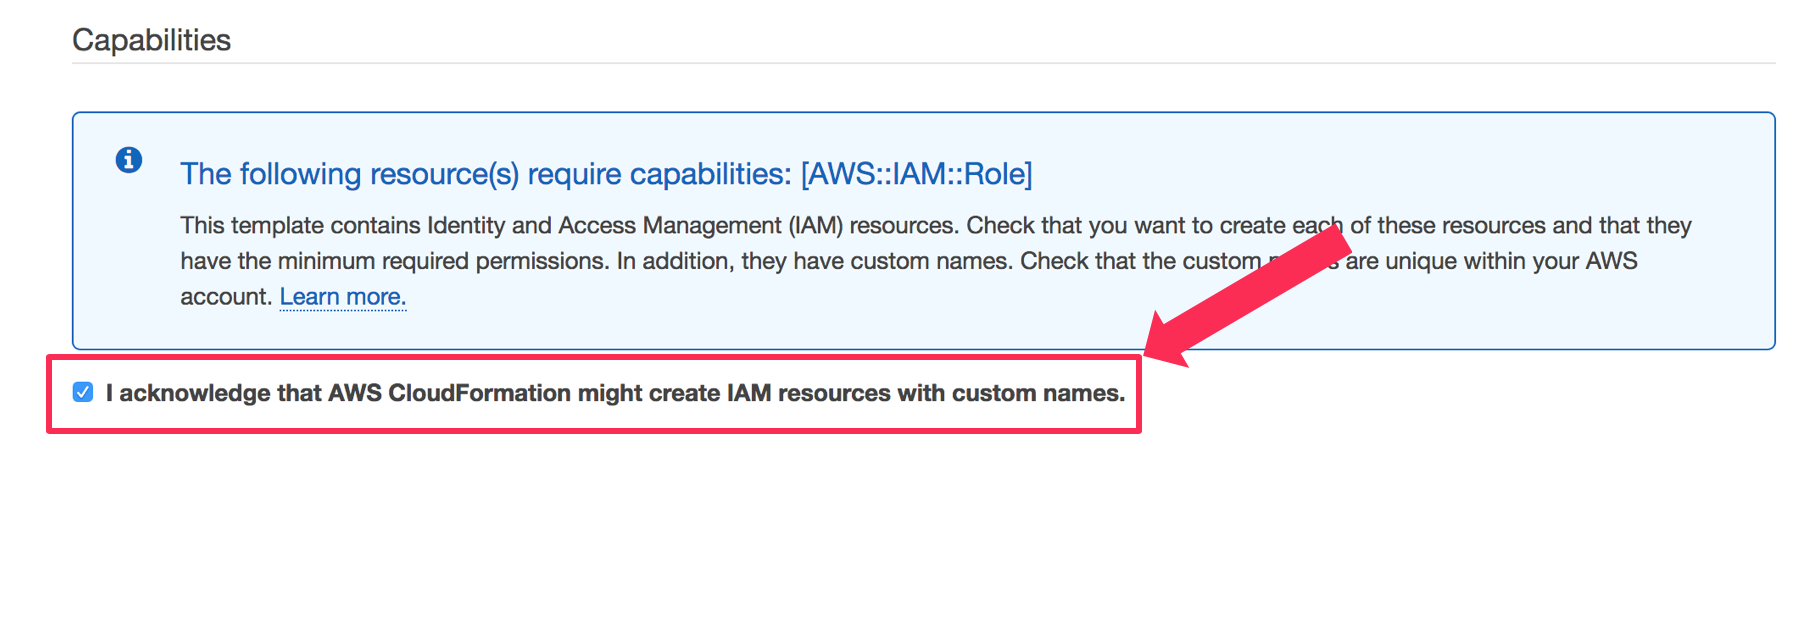
On the Review page, scroll down and check the box next to I acknowledge that AWS CloudFormation might create IAM resources with custom names.
 {width=“6.49950021872266in” height=“1.6393438320209974in”}
Click Create Stack.
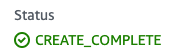
The stack will take about 15 minutes to deploy. Wait until CloudFormation shows the stack Status as CREATE_COMPLETE (You will need to click the refresh button on the right-hand corner to see if the status has changed)
 {width=“1.2222222222222223in” height=“0.3888888888888889in”}
Enable Cognito sign on for Amazon Elasticsearch Service
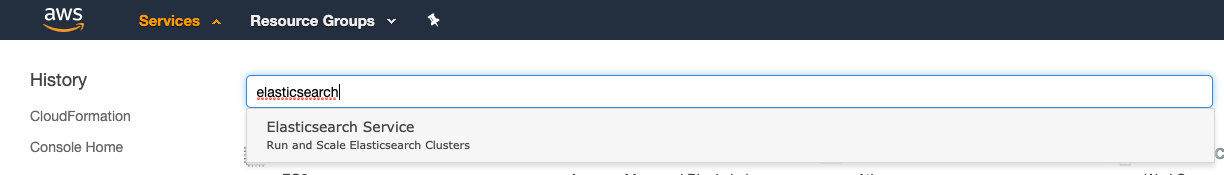 {width=“7.393055555555556in” height=“1.05in”}Click Services and type Elasticsearch. Click Elasticsearch Service.
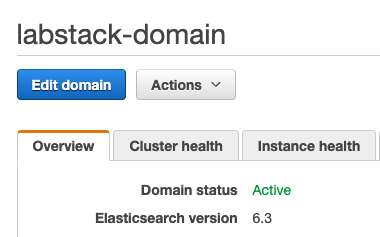
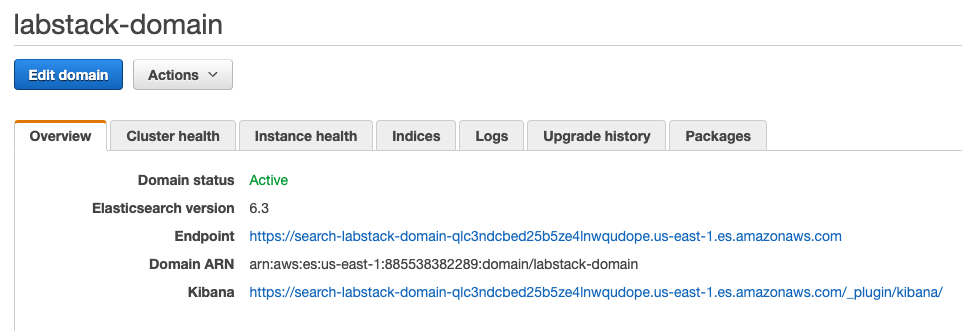
Looking at the Dashboard find and click on the domain you just created, named <stack prefix>-domain to view the domain’s dashboard.
Click Edit Domain.
 {width=“2.638888888888889in” height=“1.6388888888888888in”}
Scroll down to the Amazon Cognito authentication section, and click Enable Amazon Cognito for authentication.
Leave the Region as US East (N. Virginia)
In the Cognito User Pool drop down, select the user pool named <stack prefix>UserPool.
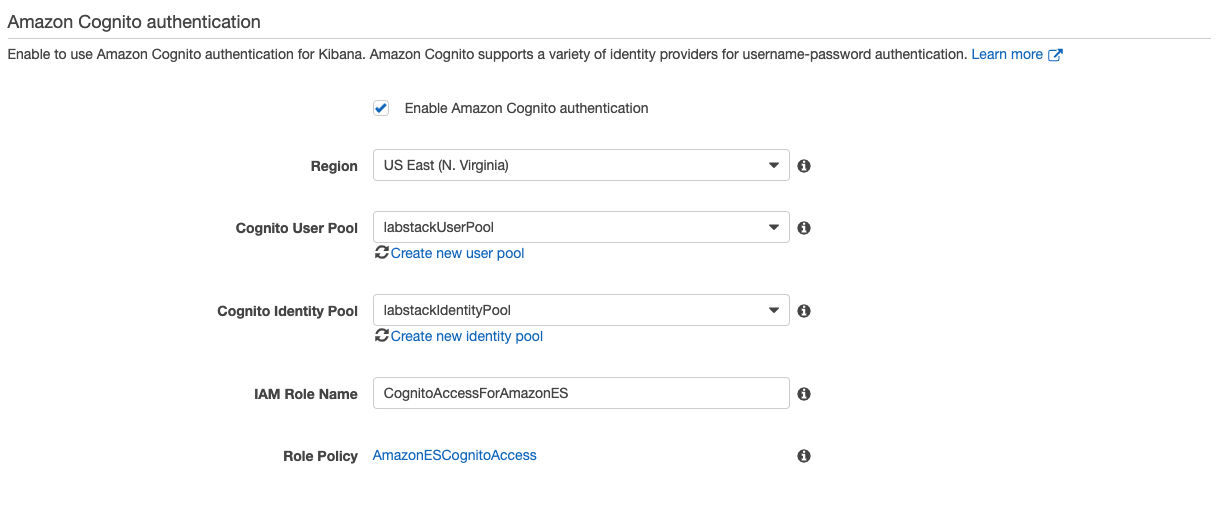 {width=“6.8125in” height=“2.823611111111111in”}In the Cognito Identity Pool drop down, select the identity pool named <stack prefix>IdentityPool.
Click Submit.
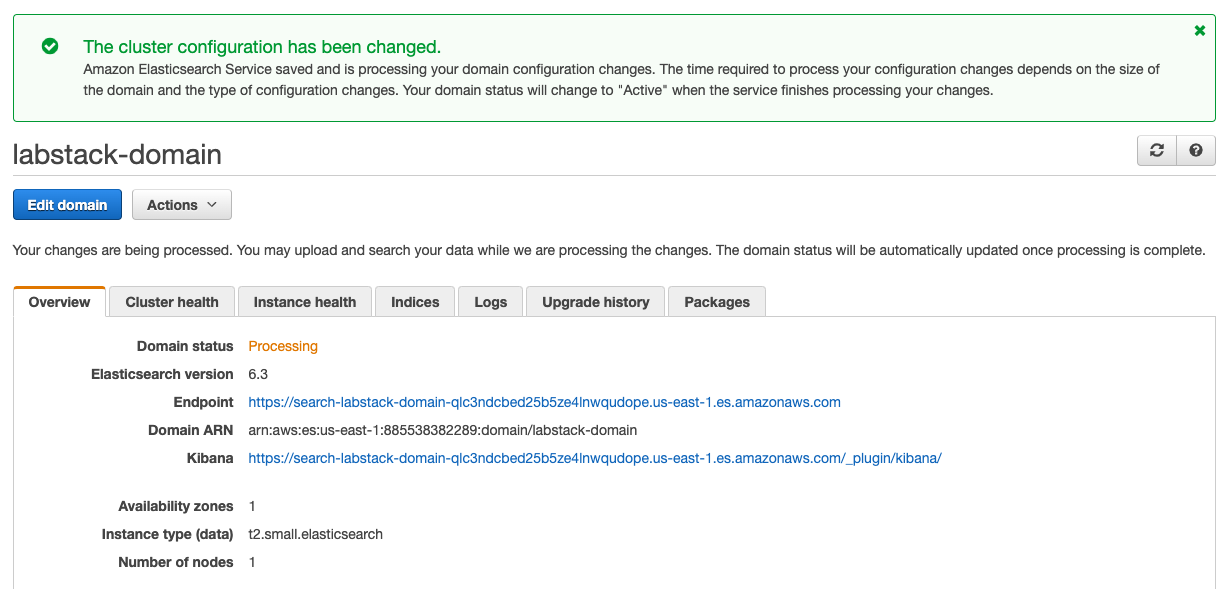
Your domain will enter the Processing state. This will take approximately 10 minutes to complete. Wait until the domain changes to the Active state before going on to the next section.
 {width=“6.8125in” height=“3.2618055555555556in”}
Start streaming logs from CloudWatch Logs to Amazon ES
From the Services Dropdown, select the Cloudwatch Service.
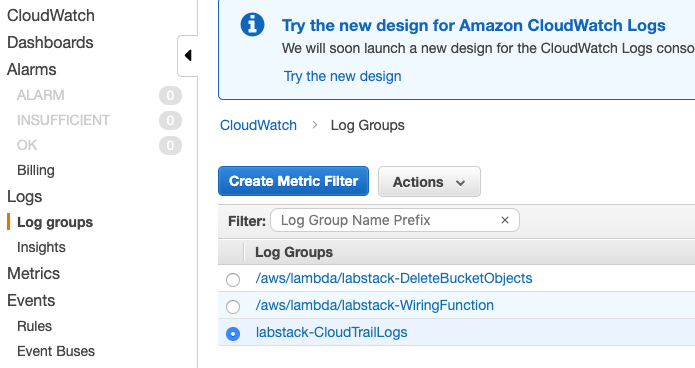
From the CloudWatch console select Logs Groups in the left-hand navigation.
Locate the log group associated with the lab <stack prefix>-CloudTrailLogs.
Click the radio button next to your log group (don’t click the name of the group itself).
 {width=“4.819444444444445in” height=“2.5555555555555554in”}
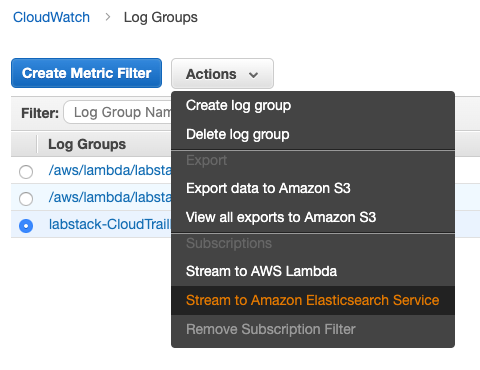
From the Actions menu, select Stream to Amazon Elasticsearch Service.
 {width=“3.3333333333333335in” height=“2.5694444444444446in”}
Select your domain from the Amazon ES cluster menu.
From the Lambda IAM Execution Role menu, select <stack prefix>-CWLRoleForStreaming.
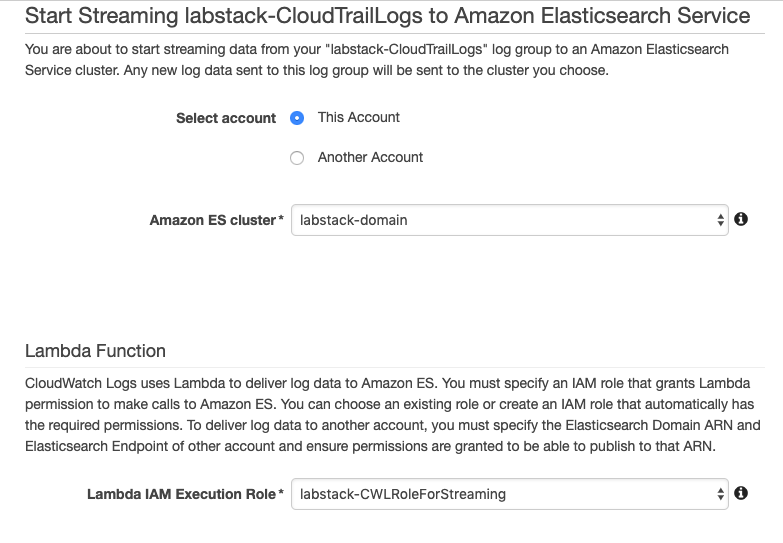 {width=“5.430555555555555in” height=“3.763888888888889in”}
Click Next.
For Log Format, select AWS CloudTrail.
Leave the other fields at their defaults and click Next.
On the Review page, click Next.
Click Start Streaming.
Log in and set up Kibana
Navigate to the Elasticsearch Cluster (From the Services Menu)
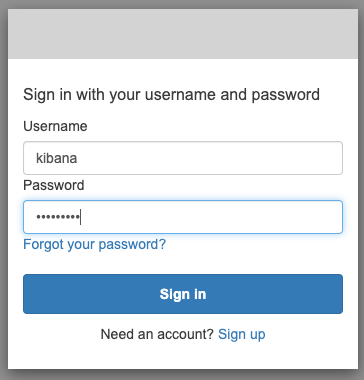
In your domain’s dashboard, click the Kibana link.
 {width=“6.680555555555555in” height=“2.2916666666666665in”}
Sign in to Kibana: for Username, type kibana for password, type Abcd1234!
 {width=“2.5277777777777777in” height=“2.638888888888889in”}
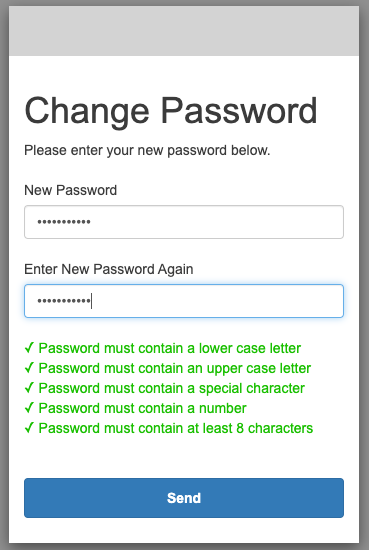
You need to set a new password. Make sure it’s at least 8 characters long, has at least 1 capital letter and 1 special character. Click Send when you’ve entered your New Password and Entered your New Password Again.
 {width=“2.5555555555555554in” height=“3.8194444444444446in”}
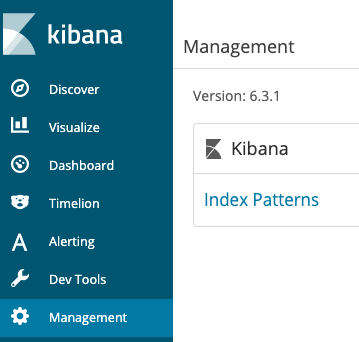
You’ll see Kibana’s splash screen. Click the Management tab at the left of the screen.
Click Index Patterns.
 {width=“2.486111111111111in” height=“2.375in”}
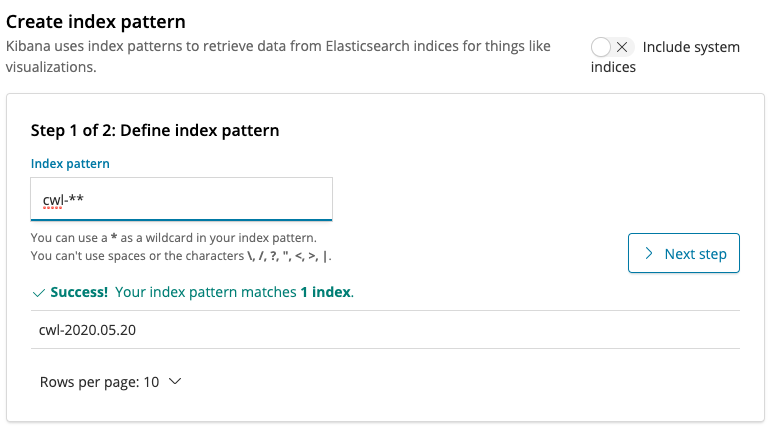
Enter cwl-* in the Index Pattern text box and click Next step.
 {width=“5.388888888888889in” height=“3.0in”}
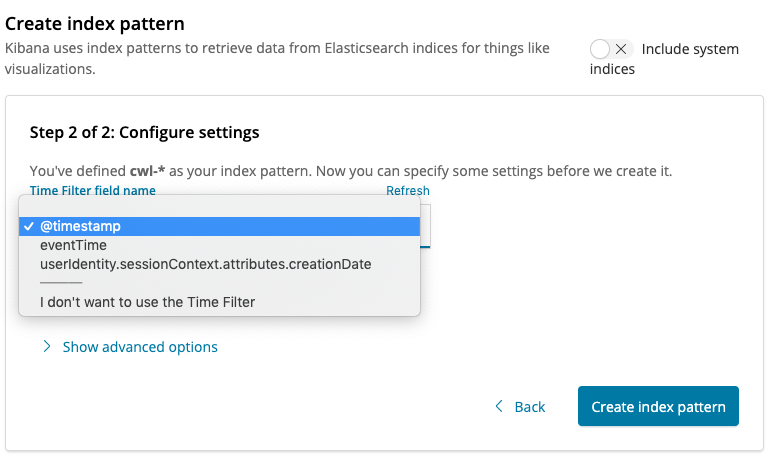
Select \@timestamp from the Time Filter field name menu and click Create Index Pattern.
 {width=“5.375in” height=“3.1805555555555554in”}
Begin exploring your data in the Discover pane
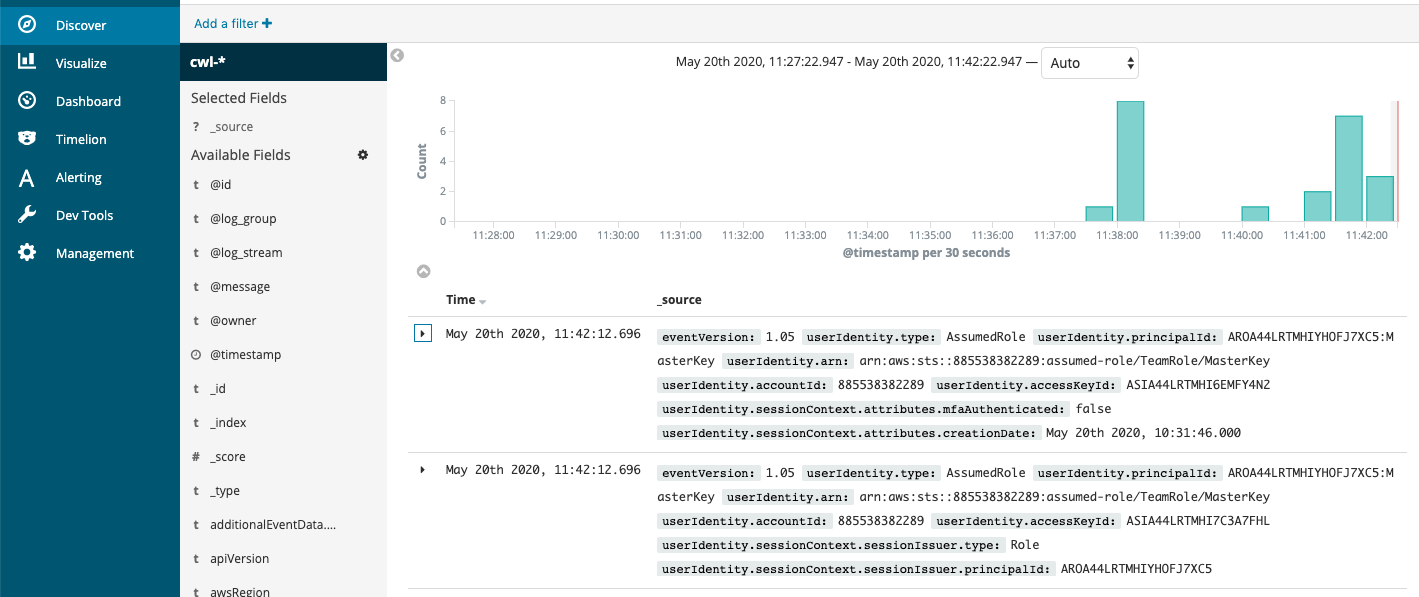
Select Discover in the left rail
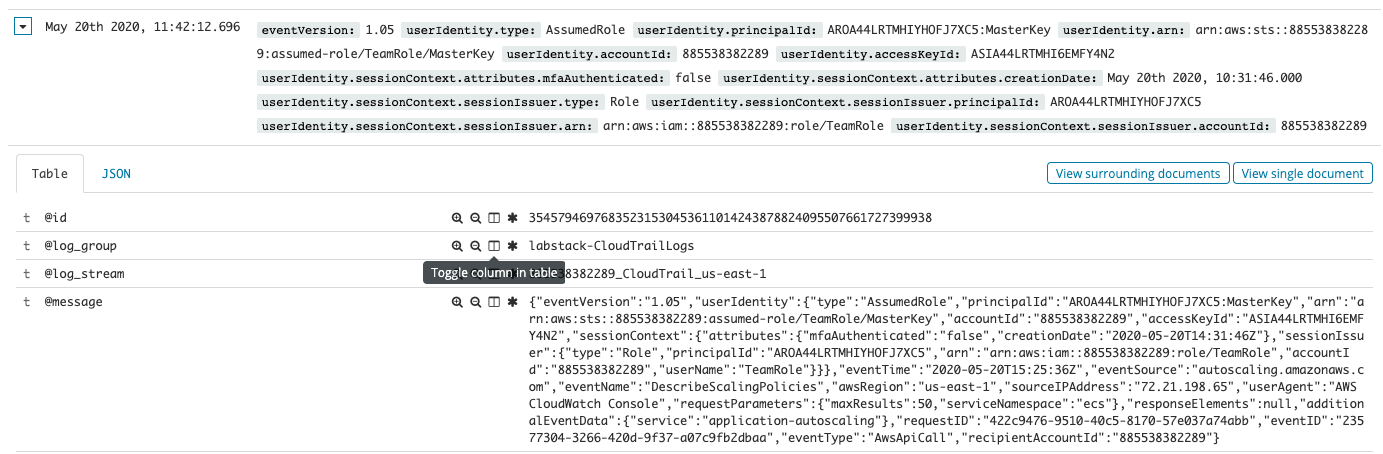
The default view shows events that occurred in the last 15 minutes. At the top, you can see a graph of the events occurring over time. Below, each event is summarized. A discovery triangle allows you to reveal the field-by-field details of each event. Have a look at a few events to familiarize yourself with the kind of data that CloudTrail logs.
 {width=“6.8125in” height=“2.8631944444444444in”}
You can search this content, using the search box to enter terms. Search now for “es.amazonaws.com” (make sure to include the double-quotes). This will show you events that occurred with es.amazonaws.com anywhere. You can employ Lucene query syntax to search specific fields and use Boolean logic for more complicated searches.
Kibana has an easier way to filter values in or out. First, create a tabular view of the important fields. Expand the triangle next to one of the events. Then click the icon that looks like a book next to the awsRegion, eventName, eventSource, and userIdentity.accountId fields.
 {width=“6.8125in” height=“2.2381944444444444in”}
Scroll back up and close the reveal triangle for the record you’re focused on. You’ll see your data layed out in table form. In my display, I have many calls to ListDomainNames and DescribeElasticsearchDomain. If you move your mouse over the table, you’ll see two icons appear (
 {width=“0.2991447944006999in” height=“0.16107830271216098in”}) you can click these to filter values in or out. Use the
  {width=“0.2916666666666667in” height=“0.2916666666666667in”}icon to filter out ListDomainNames, DescribeElasticsearchDomain, and DescribeElasticsearchDomains. This will leave a relatively small set of calls (you can also continue to filter out events). Locate the UpdateElasticsearchDomainConfig log line and expand it. You can see all of the details of the changes you made via the console to add Cognito authentication to your domain. You could also use the search box to find that record.
This method of drilling into the data is a great place to start when you want to locate a particular record, a set of error codes, or even get an overall feel for the spread of values in a field.
Visualize your AWS usage with a pie chart
Click the Visualize tab, then Create a visualization.
 {width=“6.8125in” height=“1.9479166666666667in”}
You can see that Elasticsearch provides a number of different visualizations for underlying data. Click the Pie chart.
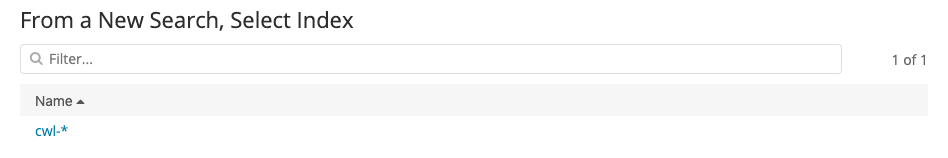
On the following screen, you tell Kibana which index pattern to use as a data source for the visualization. We’ve only set up one. Click cwl-*.
 {width=“6.583333333333333in” height=“1.0972222222222223in”}
Congratulations! You’ve made your first visualization. Unfortunately, it’s not showing anything useful at present. It’s just a pie chart of everything. To set the slices, you need to select a field that you want visualized.
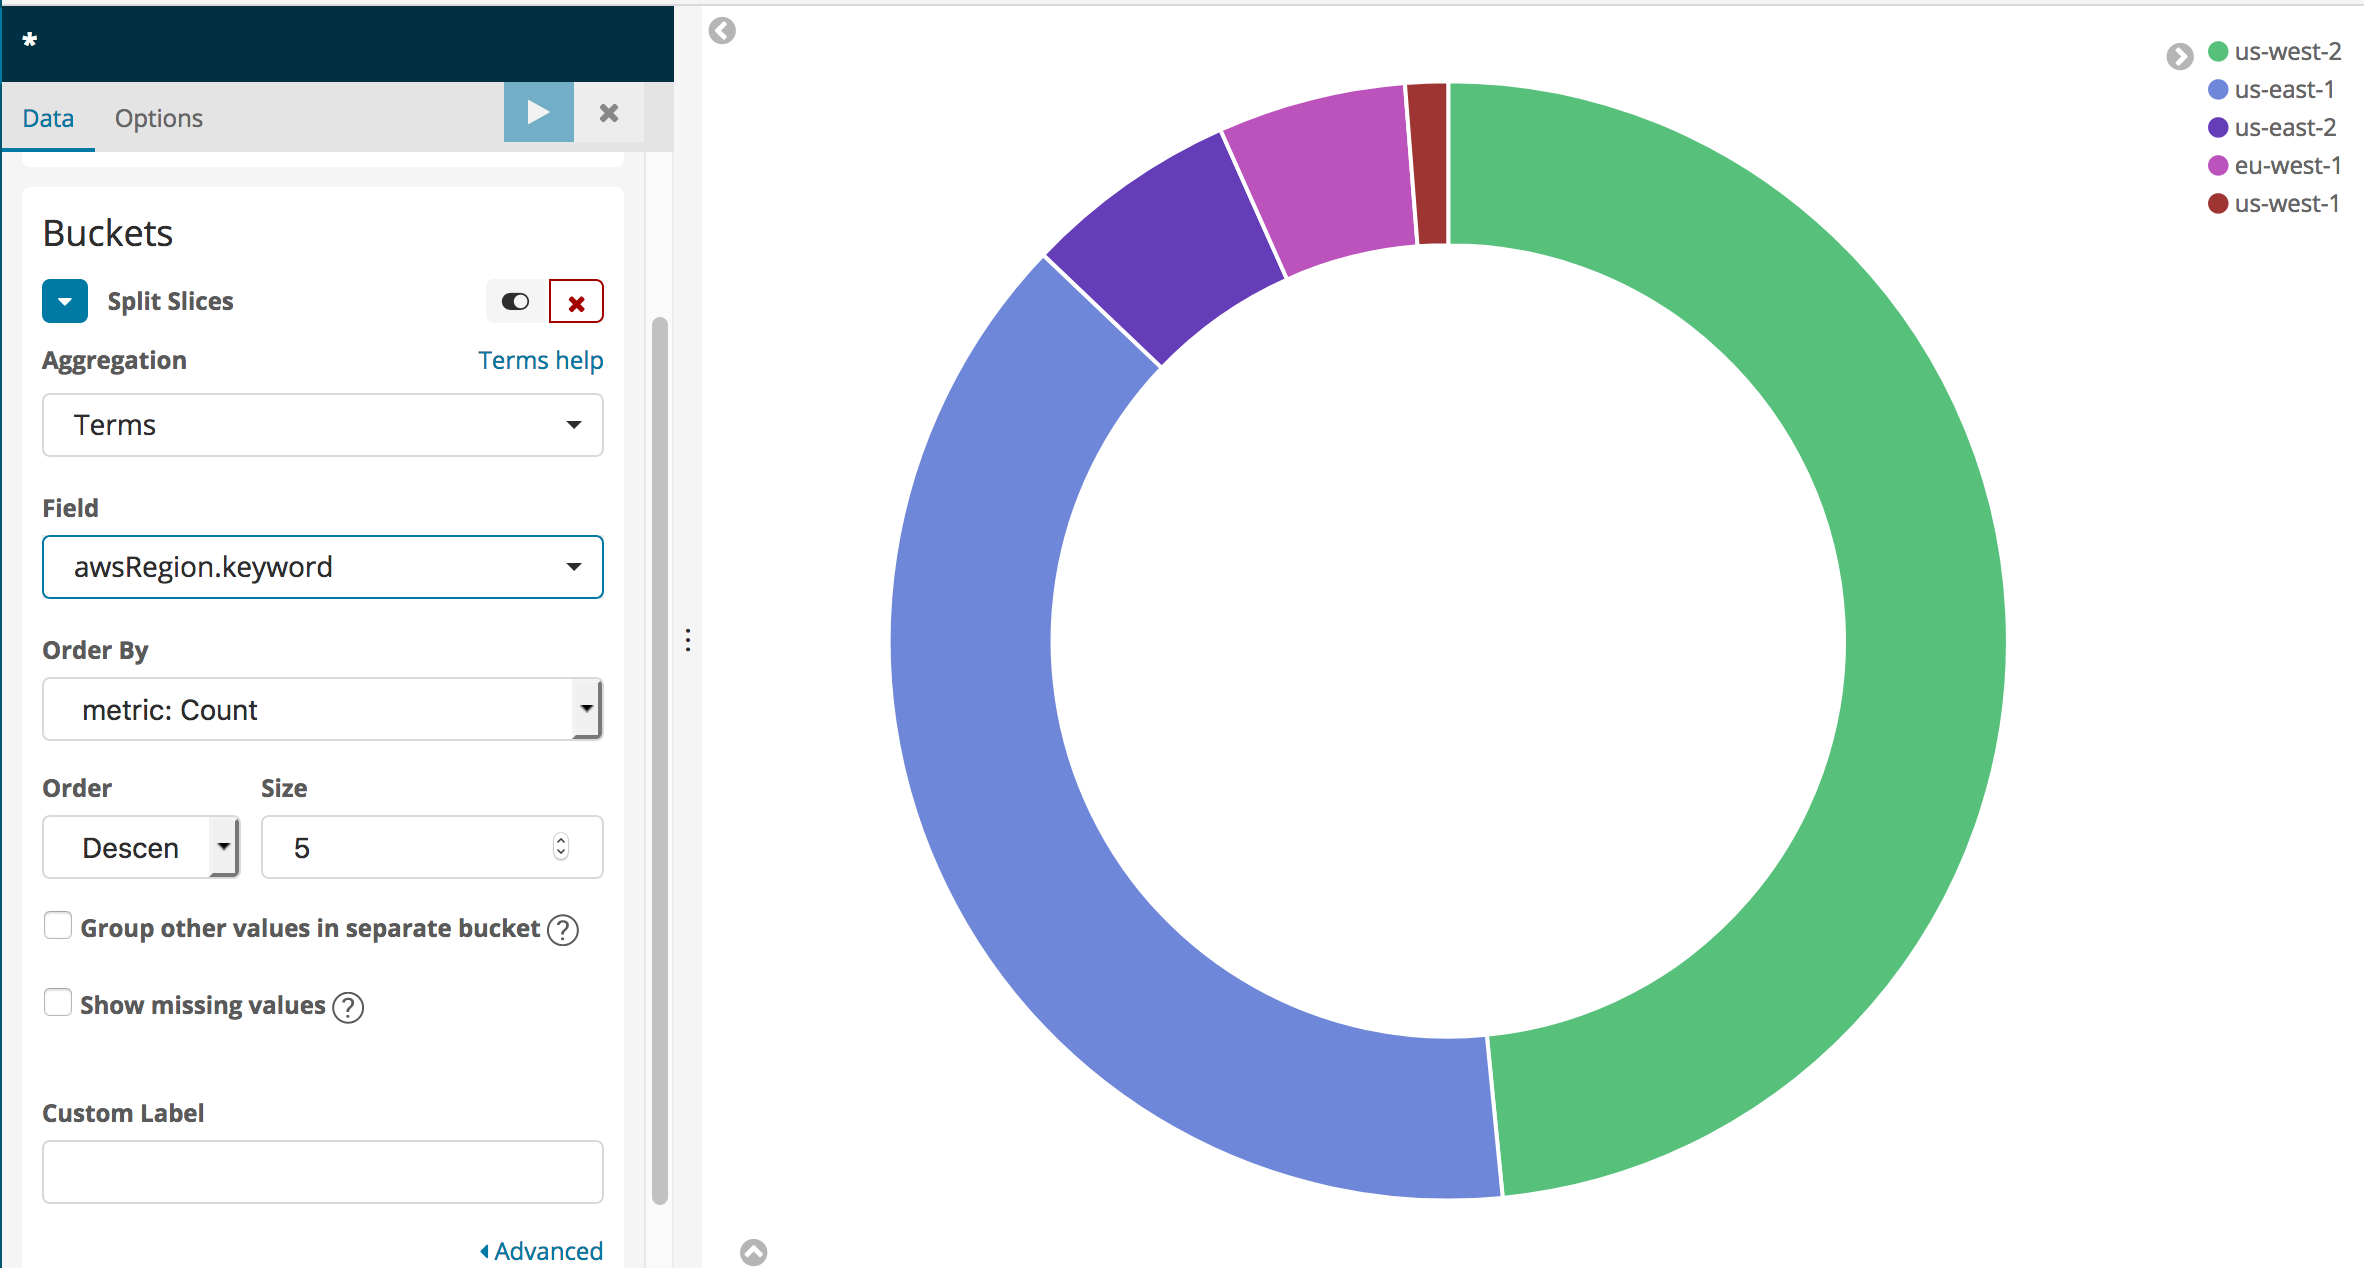
Under Buckets, click Split Slices. This will reveal a new menu, Aggregations. From that menu, choose Terms (You might have to scroll the menu to see it, it’s at the bottom). Click to drop down the Fields menu and the search box. Type awsRegion.keyword in the search box, and click its item in the menu. Finally, click
 {width=“0.2322911198600175in” height=“0.2190168416447944in”} to apply the changes.
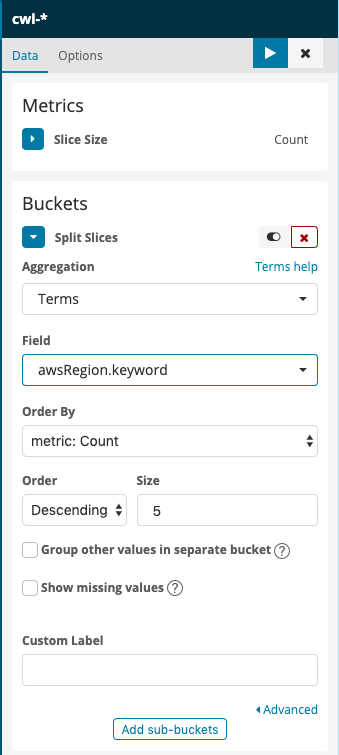 {width=“2.261780402449694in” height=“2.614753937007874in”}
This will give you a more informative pie chart that shows the regions for the CloudTrail logging data (The Lab Accounts only have entries corresponding to us-east-1).
 {width=“5.103930446194226in” height=“2.7377045056867892in”}
You can experiment with adding a search term in the search bar above the visualization. For instance, to see a regional breakdown of Amazon Elasticsearch Service API calls, type eventSource:\“es.amazonaws.com\“. Your pie chart will change to show only calls matching the search term – that is, calls to Amazon Elasticsearch Service. Clear your search by changing the search text to *.
You can also see a service and call breakdown by region by clicking Add sub-buckets at the bottom of the left rail (you might have to scroll down to see it).
Click Add sub-buckets, then choose Split Slices again. Select Terms as the Sub aggregation and eventSource.keyword as the Field. Apply the changes to see which services you are calling in the regions displayed.
Add another Terms, Sub-bucket for the userIdentity.accountId field.
You can work with textual data using Terms aggregations in a number of different forms: Pie Charts, Histograms, Line Graphs, and more. Experiment with the different Fields in the domain to see what you can generate.
You can also save your visualization and build it into a dashboard. Click Save at the top of the screen. Type Pie Chart by Region as the Name.
Visualize call volume by region
Select Visualize in the left rail.
You will see your saved visualization. Click the
 {width=“0.28688429571303586in” height=“0.22950787401574804in”} to create a new visualization.
Scroll down, and select Visual Builder.
You will see a time-based graph of all of the calls logged by CloudTrail. Drop the Group By menu and select Terms.
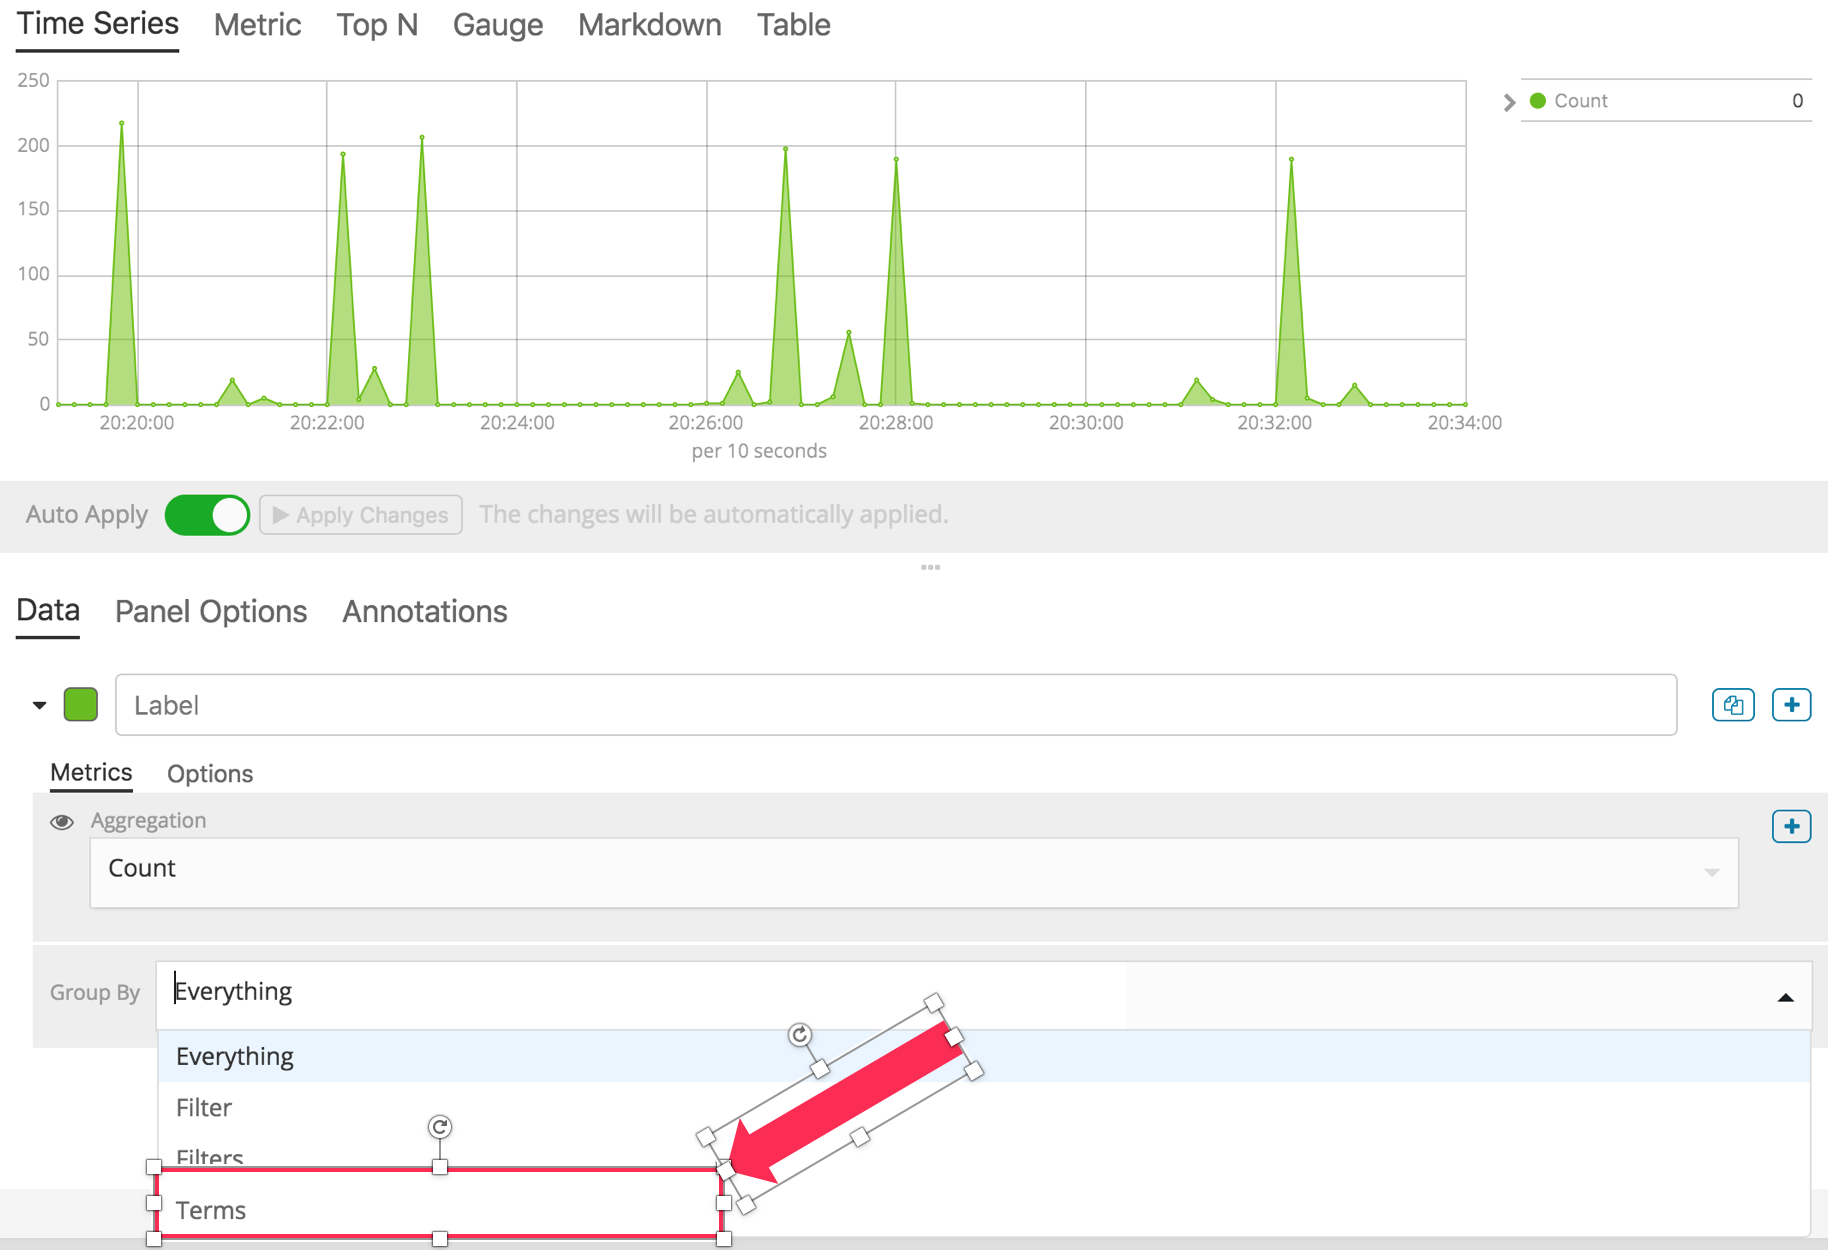 {width=“4.9098359580052495in” height=“3.357306430446194in”}
For By, use the search box or scroll to select awsRegion.keyword. You now have a graph of calls logged by CloudTrail, by region.
Click Save at the top of the screen to save your visualization. Name it Calls by region.
Add real-time updating
Click
 {width=“0.8770494313210848in” height=“0.21333661417322836in”}at the top of the screen.
Choose a Refresh Interval. 30 seconds or more are good choices.
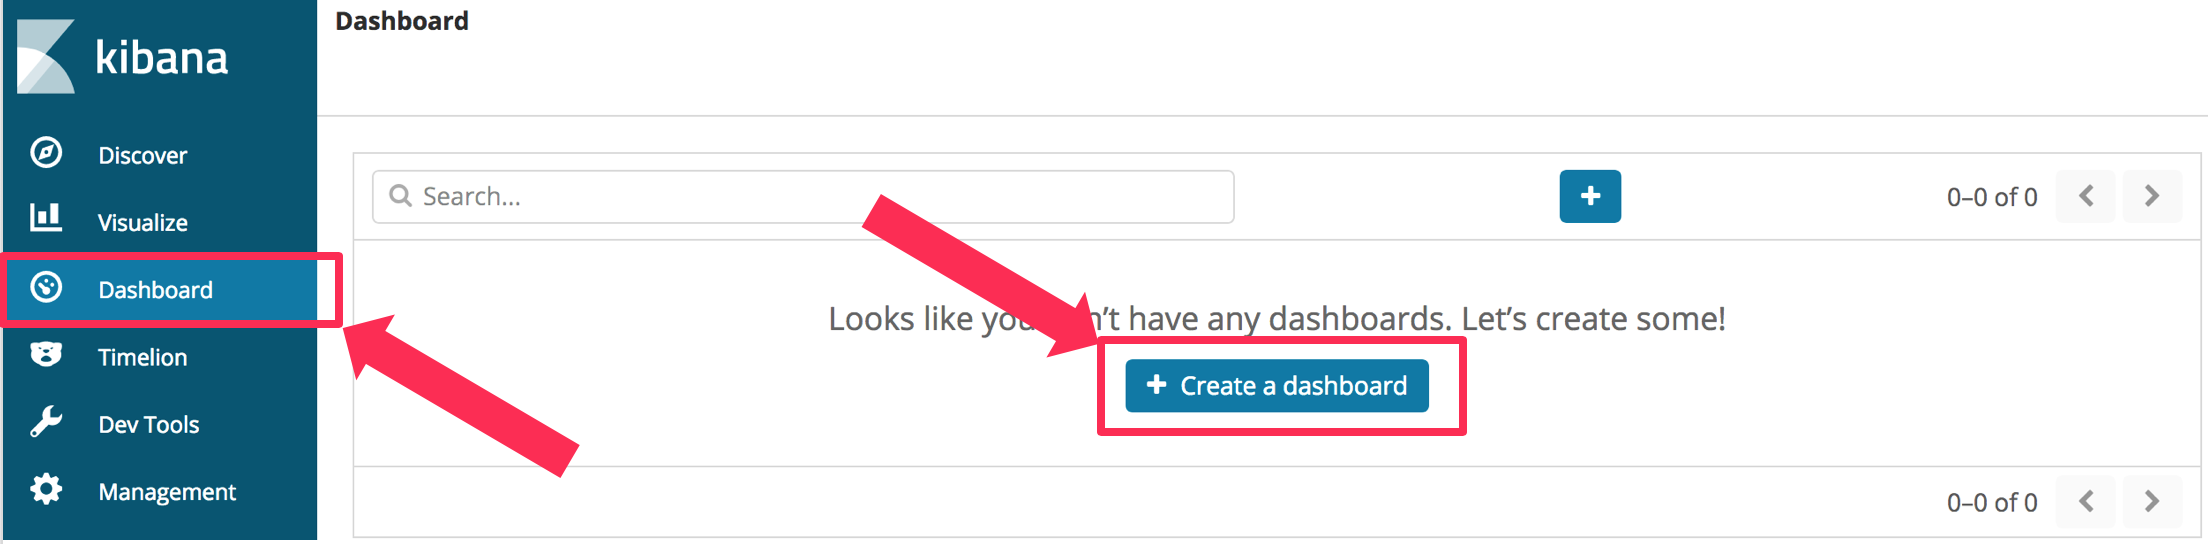
Build a dashboard
Select the Dashboard pane, and choose Create a dashboard.
 {width=“6.387541557305337in” height=“1.5737707786526685in”}
Click the Add button
Click Calls by Region and then Pie Chart By Region.
Click the Add button at the top of the screen to collapse the Add Panels pane.
You can adjust the size and position of the panes. You can also Save your dashboard so that you can open it next time you use Kibana.
[OPTIONAL] Generate traffic to S3 and monitor it
For further investigation, we have also created a CloudFormation template that creates a Lambda function to put random keys to S3. You can use CloudTrail to capture and stream read and write events to this bucket. You can use Kibana to create a visualization to monitor these events. If you don’t want to follow these steps, skip down below to the Cleanup section.
Navigate to the CloudFormation console (Services menu, search for and select CloudFormation).
Click Create Stack
Choose Specify an Amazon S3 template URL and paste the following URL in the text box
https://s3.us-east-2.amazonaws.com/search-sa-log-solutions/cloudtrail/S3-Traffic-Gen-Lambda.jsonClick Next.
Enter a Stack Name and a Stack Prefix (I used s3gen for both)
Click Next.
Scroll to the bottom of the Options page and click Next.
Scroll to the bottom of the Review page, Click the check box next to I acknowledge that AWS CloudFormation might create IAM resources with custom names.
Click Create Stack.
Wait until the stack status is CREATE_COMPLETE. Now you need to enable logging S3 events.
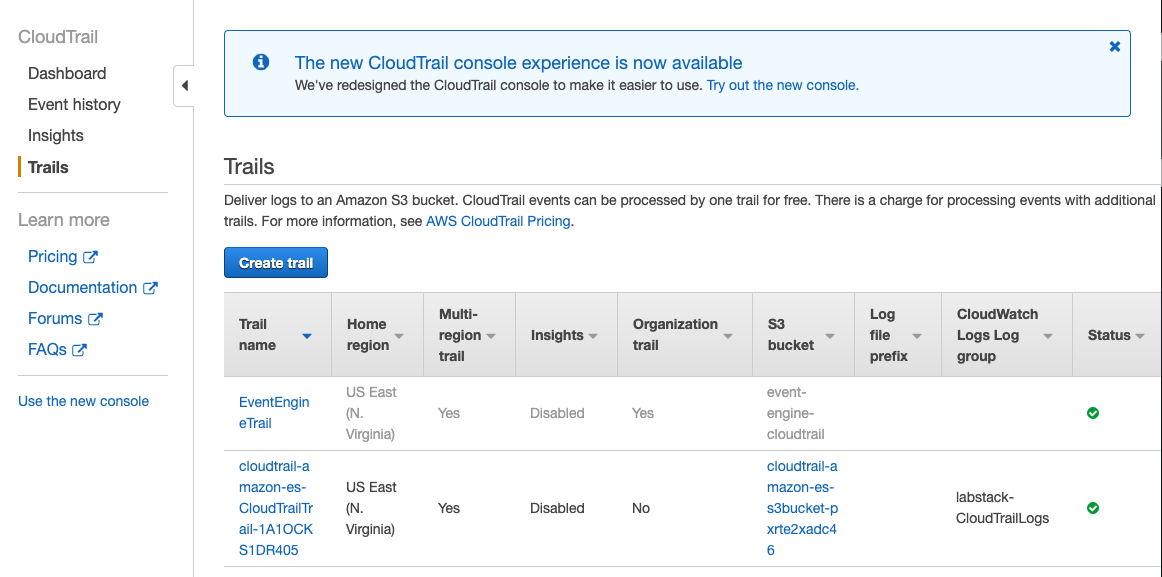
Navigate to the CloudTrail Console (Services menu, search for and select CloudTrail).
Select Trails and find the trail generated by the first stack, above. Click the trail’s name to open its configuration page.
 {width=“5.835416666666666in” height=“2.892361111111111in”}
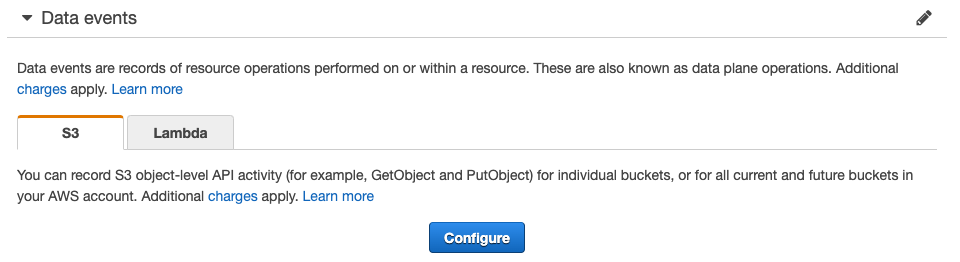
Scroll down to the Data Events section and click Configure.
 {width=“6.666666666666667in” height=“1.8194444444444444in”}
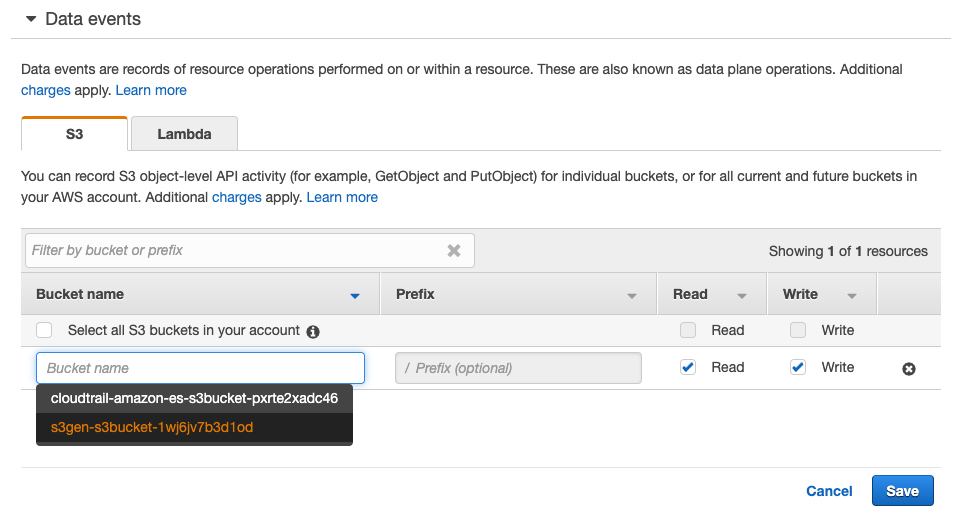
Click Add S3 Bucket
In the Bucket name text box, start typing your stack prefix from the second stack until you find your <stack prefix>-s3bucket-<uuid>. Select it.
You can choose to enable Read or Write events or both.
Click Save.
 {width=“6.666666666666667in” height=“3.611111111111111in”}
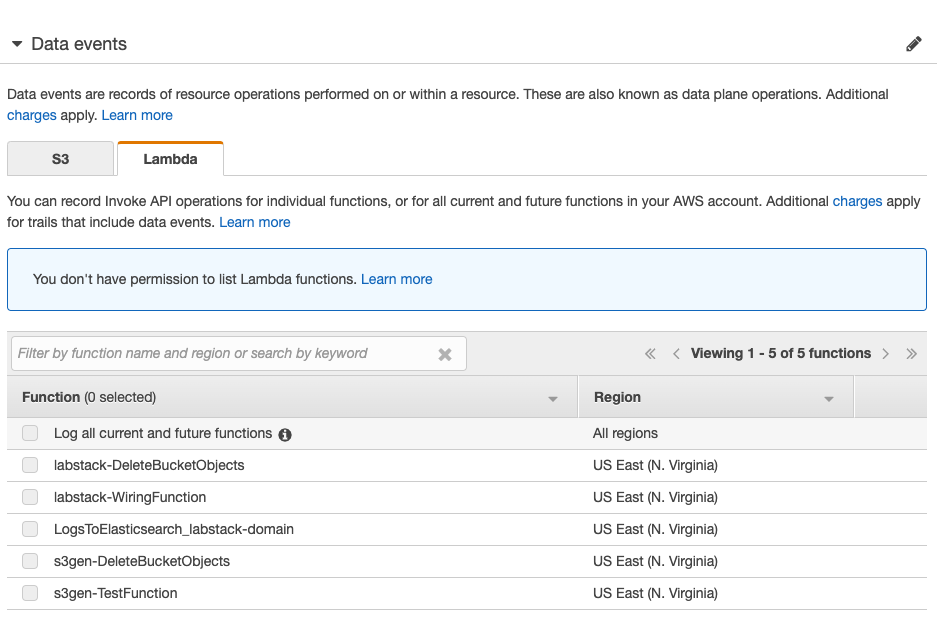
Note, you can also configure Lambda data events by selecting the Lambda tab and configuring it.
 {width=“6.541666666666667in” height=“4.361111111111111in”}
Navigate to the Lambda console (Services menu, search for and select Lambda)
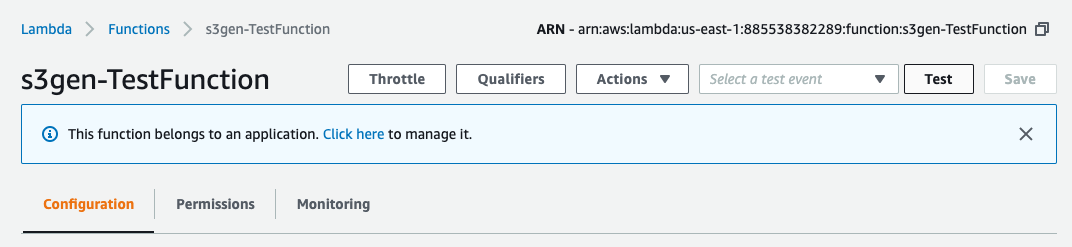
Find the function named <stack prefix>-TestFunction. Click the function’s name.
Click the Test button.
 {width=“6.8125in” height=“1.5631944444444446in”}
Give the test data an Event name. You can leave the default values. Scroll down and click Create.
Click the Test button again. The Lambda function will run for 5 minutes, creating objects in the S3 bucket.
[OPTIONAL] Visualize S3 data events
In this example, you’ll create a time-based line graph, scoped to a particular search query.
Navigate back to Kibana. You might have to wait for the objects to arrive in your Amazon ES domain. (You can use the search bar and search for PutObject to find these events)
Click Visualize and then click the
{width=“0.28688429571303586in” height=“0.22950787401574804in”} to create a new visualization.Create a Line graph.
Click cwl-* as the Name.
Set the X-Axis to bucket by time. For Bucket, click X-Axis.
For the Aggregation, select Date Histogram. You now have time buckets along the X-Axis, and the event count on the Y-Axis. This is a very common graph to create. You can change the Y-Axis settings to graph sums, averages, etc. for numeric fields.
In this case, we want to graph GetObject, PutObject, and DeleteObject separately on the same graph.
In the X-Axis section, click Add sub-buckets.
For the Buckets type, click Split Series.
For the Sub Aggregation, select Filters from the menu.
In the Filter 1 box, type eventName:\“GetObject\” (with the quotation marks).
Click the Add Filter button.
In the Filter 2 box, type eventName:\“PutObject\”.
Click the Add Filter button.
In the Filter 3 box, type eventName:\“DeleteObject\”.
Click
 {width=“0.22950787401574804in” height=“0.22233595800524936in”} to make the changes.
You will not have any GetObject or DeleteObject events at this time. You can go to the S3 console and click a couple of the keys, and delete a couple of the keys to see those events
Cleanup
Return to the CloudFormation console
[OPTIONAL] If you deployed the optional stack, click the check box next to it.
[OPTIONAL] From the Actions menu, select Delete stack.
[OPTIONAL] This will clean up the bucket and all of the objects in it. You can return to Kibana to see the DeleteObject events.
Click the check box next to your stack.
From the Actions menu, select Delete Stack.
[Depending on how long you’ve run the stack, the DeleteRawBucketObjects Lambda invocation might fail. If that happens, wait for the stack status to become DELETE_FAILED. Then delete the stack again.]
Conclusion
Congratulations! You now know how to:
Send CloudTrail logs to CloudWatch Logs
Create a subscription filter to send logs from a CloudWatch Logs log group to Amazon ES
Build Kibana visualizations and dashboards to monitor your AWS usage
Additional Resources
For more information about Elasticsearch, see https://aws.amazon.com/elasticsearch-service/
For more information about Cloudtrail, see https://aws.amazon.com/cloudtrail/
For more information about Cloudwatch, see https://aws.amazon.com/cloudwatch/