Explore Kibana
Log in and set up Kibana
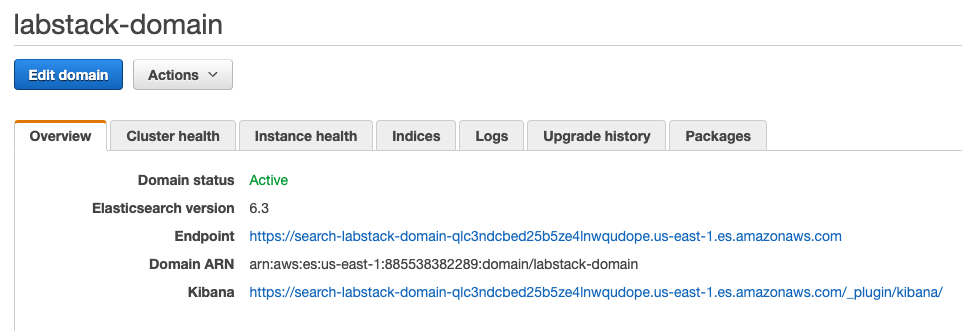
Navigate to the Elasticsearch Cluster (From the Services Menu)
In your domain’s dashboard, click the Kibana link.
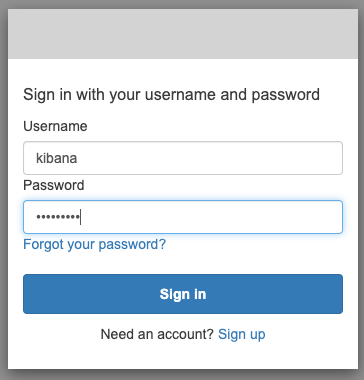
Sign in to Kibana: for Username, type kibana for password, type Abcd1234!
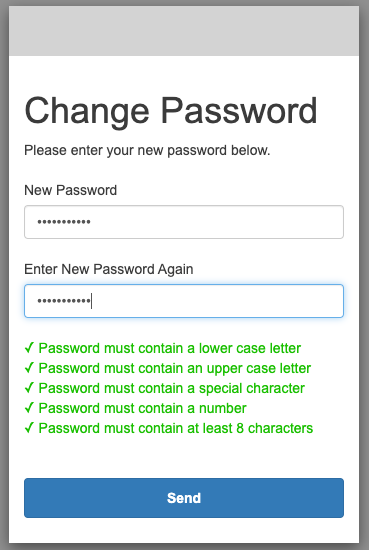
You need to set a new password. Make sure it’s at least 8 characters long, has at least 1 capital letter and 1 special character. Click Send when you’ve entered your New Password and Entered your New Password Again.
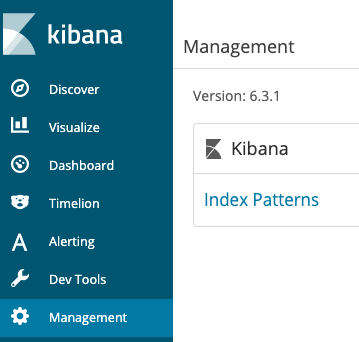
You’ll see Kibana’s splash screen. Click the Management tab at the left of the screen.
Click Index Patterns.
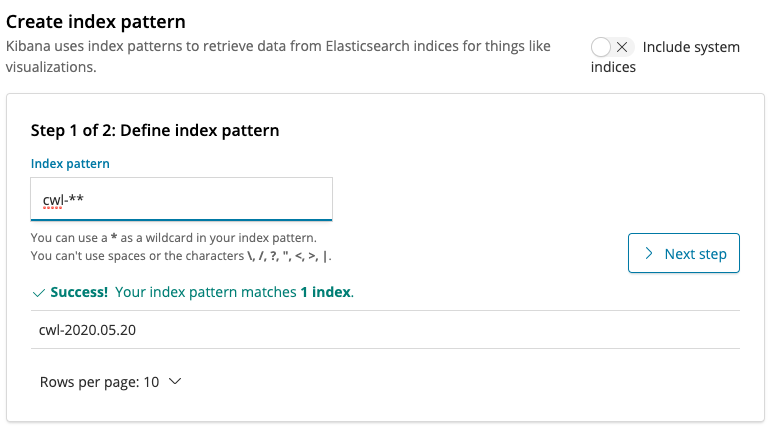
Enter cwl-* in the Index Pattern text box and click Next step.
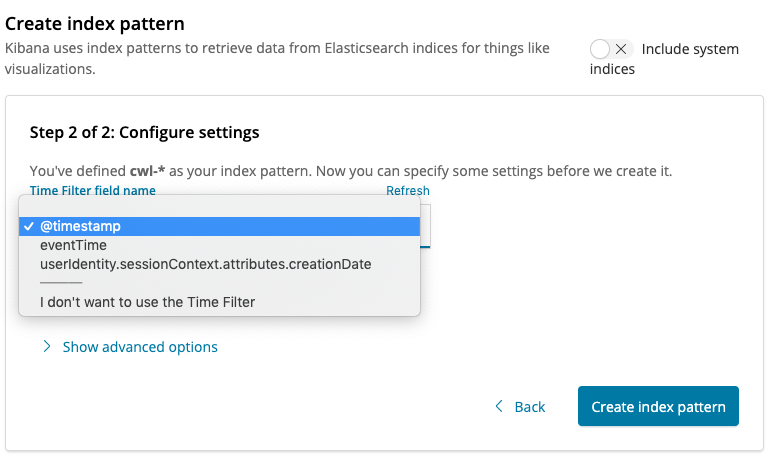
Select \@timestamp from the Time Filter field name menu and click Create Index Pattern.
Begin exploring your data in the Discover pane
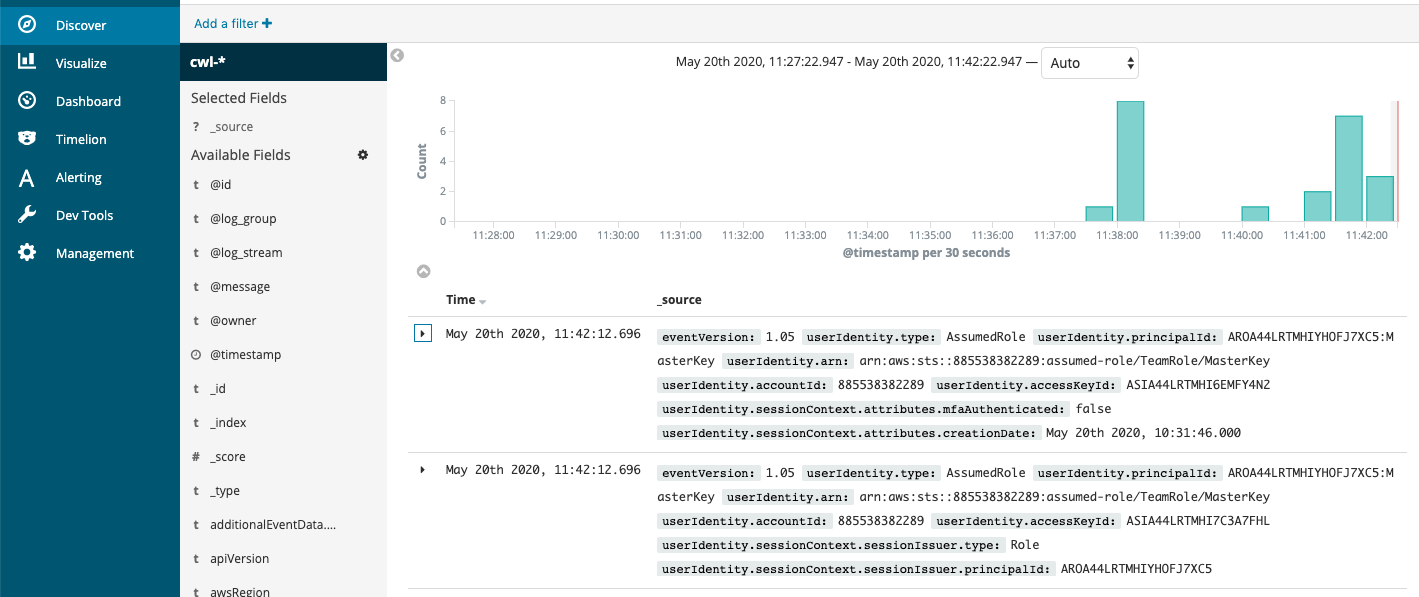
Select Discover in the left rail
The default view shows events that occurred in the last 15 minutes. At the top, you can see a graph of the events occurring over time. Below, each event is summarized. A discovery triangle allows you to reveal the field-by-field details of each event. Have a look at a few events to familiarize yourself with the kind of data that CloudTrail logs.
You can search this content, using the search box to enter terms. Search now for “es.amazonaws.com” (make sure to include the double-quotes). This will show you events that occurred with es.amazonaws.com anywhere. You can employ Lucene query syntax to search specific fields and use Boolean logic for more complicated searches.
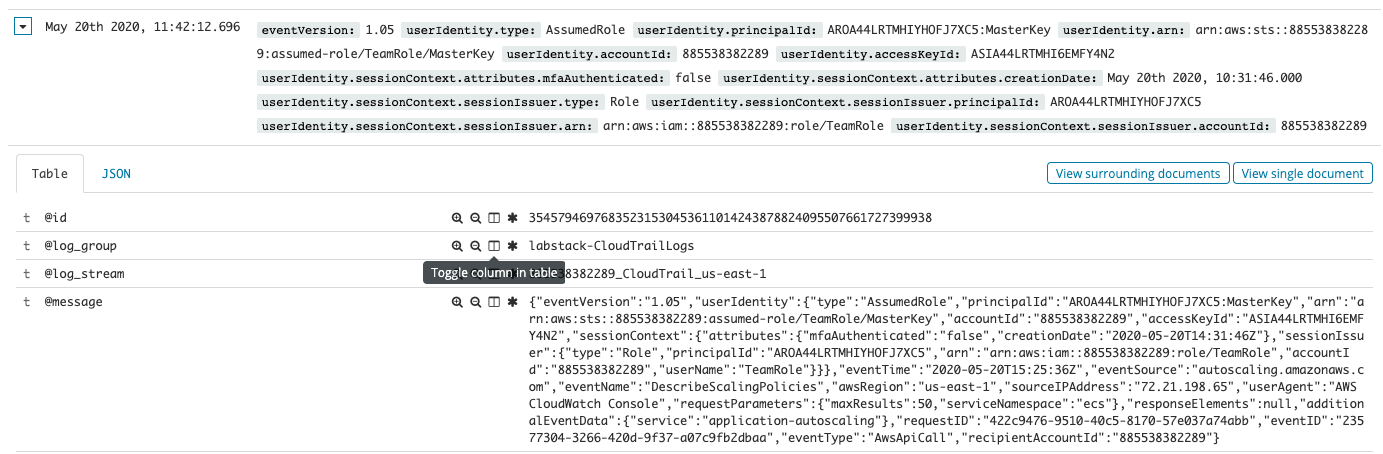
Kibana has an easier way to filter values in or out. First, create a tabular view of the important fields. Expand the triangle next to one of the events. Then click the icon that looks like a book next to the awsRegion, eventName, eventSource, and userIdentity.accountId fields.
Scroll back up and close the reveal triangle for the record you’re focused on. You’ll see your data layed out in table form. In my display, I have many calls to ListDomainNames and DescribeElasticsearchDomain. If you move your mouse over the table, you’ll see two icons appear (
 ) you can click these to filter values in or out. Use the
  icon to filter out ListDomainNames, DescribeElasticsearchDomain, and DescribeElasticsearchDomains. This will leave a relatively small set of calls (you can also continue to filter out events). Locate the UpdateElasticsearchDomainConfig log line and expand it. You can see all of the details of the changes you made via the console to add Cognito authentication to your domain. You could also use the search box to find that record.
This method of drilling into the data is a great place to start when you want to locate a particular record, a set of error codes, or even get an overall feel for the spread of values in a field.